.png)
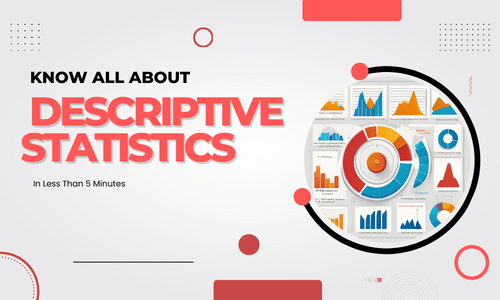
Know All About Descriptive Statistics in Less than 5 Minutes
Feb, 09 2024Discover the power of descriptive statistics in data analysis. Learn how descriptive statistics is used in R to unravel insights quickly and effectively.
Want to learn about descriptive statistics? It's all about summarizing data in numbers and graphs, so it's easy to understand. People use descriptive statistics to find patterns and trends in information. Whether it's analyzing survey answers or looking at stock market info, descriptive statistics helps make sense of it all.
Plus, if you want to learn about descriptive statistics in R, a cool data analysis tool, you're in for a treat! Knowing this stuff is super useful for students, researchers, and anyone who deals with data. So, let's dive in and discover what descriptive statistics can do for you!
In today's data-driven world, understanding descriptive statistics is crucial for anyone dealing with data analysis. Whether you're a student diving into your first research project, a seasoned researcher exploring complex datasets, or a business analyst seeking insights to drive decision-making, descriptive statistics serve as the foundation for extracting meaningful information from raw data.
Descriptive statistics in data science provide a snapshot of essential characteristics within a dataset, offering insights into its central tendencies, variability, and distribution. By summarizing data in numerical terms and graphical representations, descriptive statistics make it easier to comprehend complex information at a glance. From calculating simple measures like mean and median to visualizing data through histograms and scatterplots, these statistical techniques play a vital role in uncovering patterns, trends, and relationships within datasets.
Moreover, the advent of advanced statistical software like R has revolutionized the way we analyze data. With its extensive library of packages and functions tailored for statistical analysis, R has become a go-to tool for data scientists, researchers, and analysts worldwide. Descriptive statistics using R empower users to perform comprehensive analyses efficiently, enabling them to explore data, identify outliers, and generate visualizations with ease.
Whether you're exploring the demographics of survey respondents, analyzing sales trends over time, or examining the performance of a machine learning model, descriptive statistics is used in R which offer a versatile toolkit for data exploration and interpretation. By mastering these techniques, you'll gain the skills needed to extract valuable insights from your data, inform decision-making processes, and drive innovation in your respective field.
In this article, we'll delve into the fundamentals of descriptive statistics, explore how they're used in R for data analysis, and highlight their importance in various domains, from academia to industry. Whether you're a novice or an experienced data analyst, join us on a journey to demystify descriptive statistics and unleash the power of data-driven insights.
# Descriptive Statistics Using R
i) Introduction to Descriptive Statistics in R:
a) Descriptive statistics using R involve summarizing and visualizing data to gain insights and make informed decisions.
b) R provides powerful tools and libraries for conducting descriptive statistical analysis efficiently.
ii) Key Functions for Descriptive Statistics Using R:
a) Summary Statistics: R offers functions like summary() and describe() to calculate basic statistics such as mean, median, mode, standard deviation, and quartiles.
b) Visualization: R's visualization packages, including ggplot2 and lattice, enable the creation of informative plots like histograms, boxplots, and scatterplots to visualize data distributions and relationships.
iii) Comparison with Descriptive Statistics Using SPSS:
- While SPSS also facilitates descriptive statistical analysis, R provides greater flexibility and customization options, allowing users to tailor analyses to specific needs.
- R's open-source nature means it's continually evolving with new packages and functionalities, making it a preferred choice for many data analysts and researchers.
iv) Application of Descriptive Statistics in Data Science:
- Descriptive statistics play a crucial role in exploratory data analysis (EDA), where analysts use techniques like histograms and summary statistics to understand the structure and characteristics of datasets.
- In data science, descriptive statistics are often the first step in the analytical process, providing a foundation for more advanced modeling and inference techniques.
Conclusion:
- Descriptive statistics using R offer a comprehensive toolkit for analyzing and understanding data, making it an invaluable tool in various fields, including academia, business, and research.
- Whether you're comparing it with SPSS or utilizing it within the broader context of data science, mastering descriptive statistics using R equips you with the skills needed to extract meaningful insights from complex datasets efficiently and effectively.
# Descriptive Statistics Using SPSS
i) Descriptive statistics in SPSS encompass techniques for summarizing and exploring datasets to extract meaningful insights and patterns.
ii) SPSS provides a user-friendly interface and a wide range of analytical tools, making it a popular choice for statistical analysis in various fields.
iii) SPSS offers built-in functions for computing basic descriptive statistics such as mean, median, mode, standard deviation, and percentiles.
iv) Users can create visualizations like histograms, bar charts, and pie charts to visualize data distributions and relationships effectively.
v) While R offers greater flexibility and customization options, SPSS is favored for its intuitive interface and ease of use, making it accessible to users with varying levels of statistical expertise.
vi) SPSS's extensive library of predefined analyses and procedures simplifies the process of conducting descriptive statistical analyses for researchers and analysts.
vii) In data science, descriptive statistics serve as the foundation for exploratory data analysis (EDA), providing insights into the structure and characteristics of datasets.
viii) SPSS's descriptive statistical tools are instrumental in data preprocessing tasks, enabling analysts to clean and prepare data for further analysis and modeling.
ix) Descriptive statistics in SPSS are indispensable for researchers, analysts, and practitioners across disciplines, facilitating the extraction of actionable insights from data.
x) Whether utilized independently or as part of a broader data science workflow, mastering descriptive statistics inside SPSS equips users with the tools necessary to make informed decisions and drive impactful outcomes in their respective fields.
Descriptive Statistics in Data Science
- Descriptive statistics in data science serve as the cornerstone for analyzing and interpreting datasets, providing valuable insights into their characteristics and distributions. Data scientists leverage descriptive statistics to summarize, visualize, and understand the underlying patterns and trends within their data.
- Descriptive statistics enable data scientists to explore datasets efficiently, identifying outliers, understanding central tendencies, and detecting patterns crucial for subsequent analyses. Before diving into advanced analyses, data scientists employ descriptive statistics to clean and preprocess data, ensuring its quality and suitability for modeling.
- While SPSS offers robust capabilities for descriptive statistical analysis, its integration within the broader data science workflow facilitates seamless data exploration and hypothesis generation. Data scientists utilize SPSS's descriptive statistics functionalities to conduct preliminary analyses, validate assumptions, and prepare data for more complex modeling techniques.
- By providing concise summaries and visual representations of data, descriptive statistics empower data scientists to communicate insights effectively, informing strategic decisions and business initiatives. In data-driven environments, the ability to extract actionable insights from descriptive statistics plays a vital role in driving innovation and achieving competitive advantage.
- Descriptive statistics form the foundation of data science, offering invaluable tools for understanding, analyzing, and interpreting data. Whether it's uncovering patterns in customer behavior or optimizing operational processes, mastering descriptive statistics equips data scientists with the skills necessary to extract actionable insights and drive impactful outcomes in today's data-driven world.
# Difference Between Inferential and Descriptive Statistics
i) Inferential vs. Descriptive Statistics: Understanding the Contrast:
- While both inferential and descriptive statistics are essential branches of statistical analysis, they serve distinct purposes in the realm of data science and research.
ii) Descriptive Statistics:
- Descriptive statistics is used in summarizing and describing the features of a dataset, providing insights into its central tendencies, variability, and distribution.
- Tools like SPSS offer robust functionalities for conducting descriptive statistical analyses, including calculating measures like mean, median, and standard deviation, as well as generating graphical representations to visualize data distributions.
- In data science, descriptive statistics play a fundamental role in exploratory data analysis (EDA), enabling analysts to understand the structure and characteristics of datasets before proceeding to more advanced analyses.
iii) Inferential Statistics:
- In contrast, inferential statistics involves making inferences or predictions about a population based on a sample of data, utilizing probability theory and hypothesis testing to draw conclusions.
- Unlike descriptive statistics, which focuses on summarizing and interpreting data, inferential statistics aims to generalize findings from a sample to a larger population.
- In research and data science, inferential statistics are employed to test hypotheses, assess relationships between variables, and make predictions based on observed data.
iv) Key Differences:
- Descriptive statistics deals with summarizing and describing data, while inferential statistics involves making inferences and predictions about populations based on sample data.
- Descriptive statistics in SPSS and similar tools are primarily used for exploring and summarizing datasets, whereas inferential statistics are utilized for hypothesis testing and making predictions.
- While descriptive statistics provide insights into the characteristics of a dataset, inferential statistics allow researchers to draw conclusions and make inferences about broader populations.
v) Conclusion:
Understanding the distinction between descriptive and inferential statistics is crucial for conducting rigorous data analysis and drawing meaningful conclusions in research and data science contexts.
By leveraging both branches of statistical analysis effectively, researchers and data scientists can gain deeper insights into data, test hypotheses, and make informed decisions that drive innovation and impact.
Final Thoughts
To sum up, descriptive statistics are like a magic tool for quickly understanding data. They help in things like checking survey results, understanding stock market trends, and finding patterns in research. Using descriptive statistics in R makes it easy to see the big picture by calculating important numbers and making cool graphs.
Remember, descriptive statistics are used in lots of different areas, from school to work, to understand tricky information and make smart choices. Learning about descriptive statistics gives you superpowers to explore and explain data better, helping you to share your discoveries and make a difference in whatever you do. So, take a moment to get to know descriptive statistics—it's like having a secret weapon for understanding the world around you!
In conclusion, the significance of descriptive statistics in data analysis cannot be overstated. As we've seen, these statistical techniques provide a fundamental framework for understanding and interpreting data, serving as a launching pad for more advanced analyses and decision-making processes. Whether you're conducting research, managing business operations, or exploring trends in your personal life, descriptive statistics offer a reliable and accessible approach to uncovering valuable insights.
By mastering descriptive statistics, you'll be equipped with the skills to navigate through the complexities of datasets with confidence and clarity. Whether it's calculating summary statistics, creating insightful visualizations, or identifying outliers and patterns, these techniques empower you to extract actionable insights from your data efficiently and effectively.
Moreover, the integration of descriptive statistics is used in R which opens doors to a world of possibilities in data analysis and interpretation. With its vast array of packages and functions tailored for statistical analysis, R provides a robust platform for exploring, modeling, and visualizing data. By leveraging the capabilities of R, you can streamline your analytical workflow, enhance collaboration, and drive innovation in your field.
As we move forward in the era of big data and analytics, the importance of descriptive statistics will only continue to grow. Whether you're a student embarking on a research project, a business professional seeking to optimize operations, or a researcher exploring new frontiers, descriptive statistics will remain a cornerstone of your analytical toolkit.
In essence, descriptive statistics using R offer a gateway to a deeper understanding of data, enabling you to uncover insights, solve problems, and make informed decisions. So, embrace the power of descriptive statistics, and let your data tell its story. With the correct tools and skills at your disposal, the possibilities are limitless.
Instant Connect
First Time Client Offer: Flat 20% discount on quoted prices.